
On-demand Reports are one-click, commonly needed reports. The data in these reports is real-time and includes most current data. LAMUM offers 3 ways to create on-demand reports.
“Favorite” in your browser
- Create the report you want.
- Save the URL as a Favorite in your browser.
- Give it a user-friendly name.
- When clicked, the Favorite will create that report on-demand, with most current data.
A Link in “Favorites Tab in LAMUM”
- Create the report you want, save it to Favorites.
- Give it a user-friendly name, save.
- When you would like to see the on-demand report, just click on the link. That report with most current data will appear.
“User Dashboard”
- Choose a Dashboard medium: SharePoint, Google Doc, Word, PDF, Company Wiki, or any other file that accepts hyperlinks.
- Create the report you want in LAMUM and copy the URL (hyperlink).
- Paste the hyperlink into the medium.
- Change hyperlink to a user-friendly name.
- Organize the hyperlinks in a logical format.
- Create different Dashboards for different people – Managers, Mechanical Engineers, Electrical Engineers and others.
Note: On-demand reports generate quickly. Reports that may take a long time to generate are best set up as Batch Reports.
Real-Time Checkouts Reporting in LAMUM
Knowing current checkout status of licenses is very important:
- You can see if anyone is hoarding (sitting) on a license
- See if a license is currently available
- Determine your typical license demand
- Understanding average checkout times
Of course, not every license needs to be monitored this way. But expensive or critical licenses, with contention or “denials”, might need to be monitored regularly.
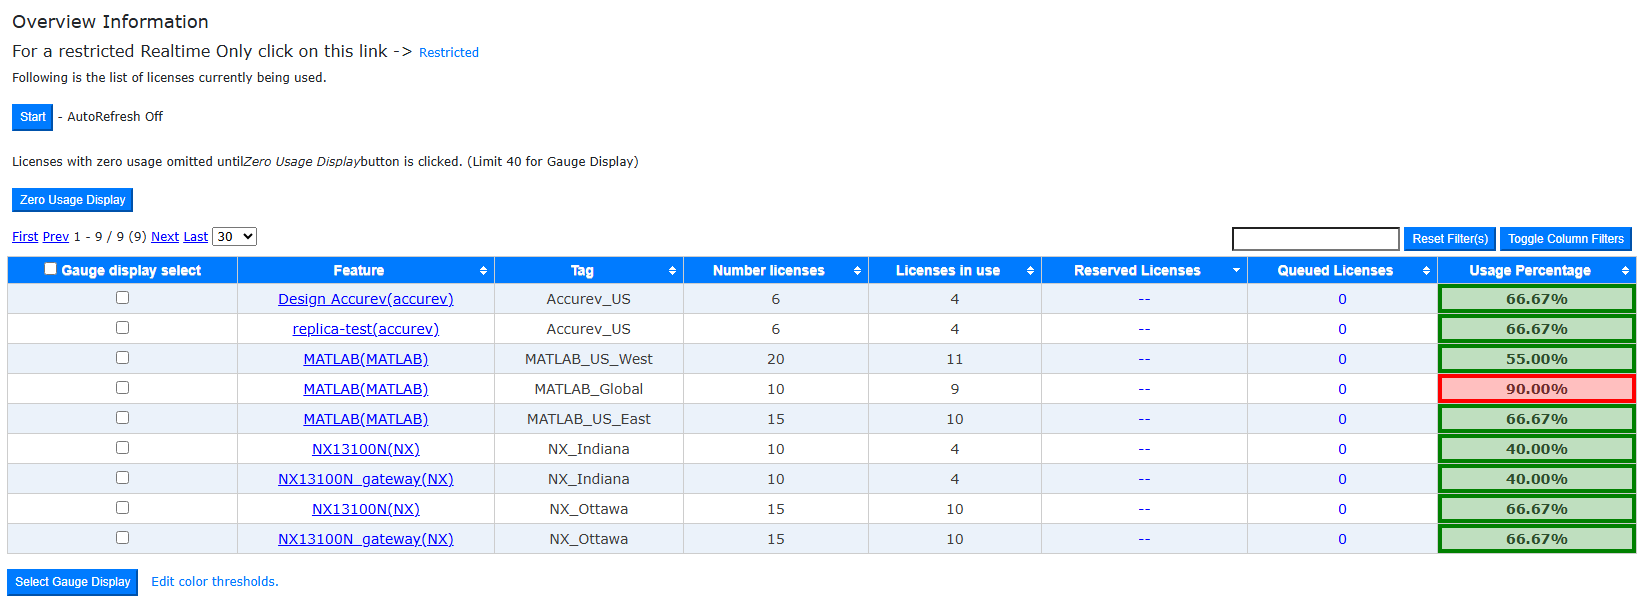
Checkouts Overview
This table shows all features currently checked out at a given Tag (port@host), User name, Feature name, Tag name, number of licenses available, and number of checked out; Also shows any licenses Reserved or Queued.
The percentage and color settings are user definable. This table can be sorted by clicking on the column heading, or filtered using the general filter box. The boxes on left are used to select features for displaying as Gas Gauges. It can auto-refresh itself if “Auto-refresh” is turned on. If “Zero Use Display” is selected, both active and non-active feature checkouts will display. This makes a great “On-Demand” report!
Current Gas Gauges Display
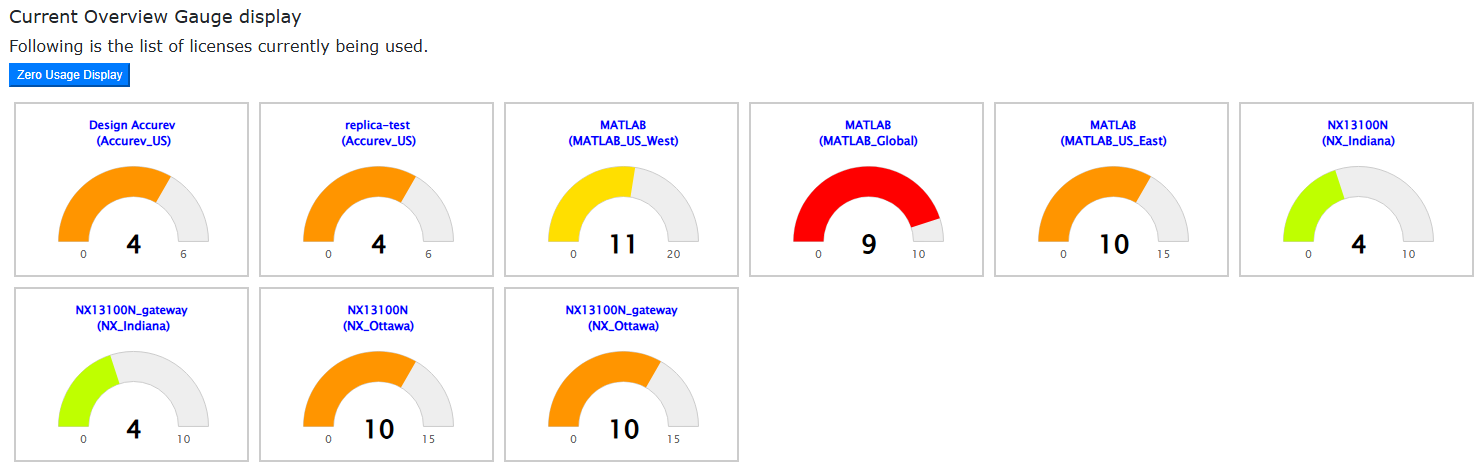
Shows current checkouts by Tool/Feature in realtime, automobile gas gauge style. The gauge is color coded as percentage of capacity.
You can see all Gas Gauges, or selected subsets of Gas Gauges by Tool, Tag, License Server, etc. Each Gas Gauge View can be saved as an “On-demand” report in the Favorites Tab or in your User Dashboard.
Every Gas Gauge includes a “blue” link to the Current Checkout Details for that Tool/Feature.
Just click on the blue and the checkout Details pops up.
Checkout Detail by Tool
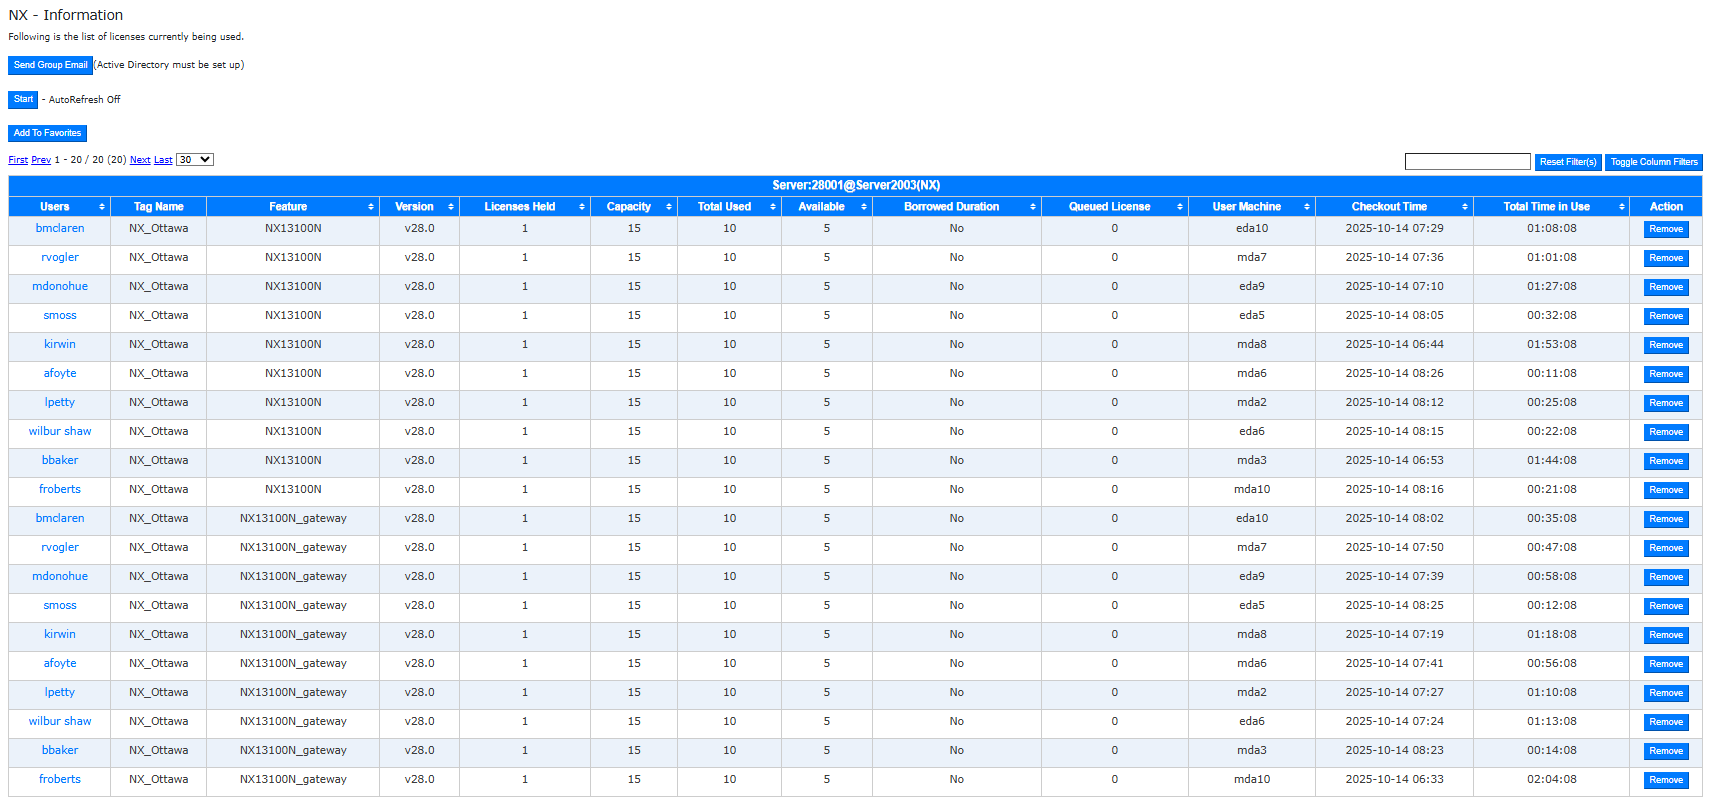
This table lists every checkout by User ID. It shows Tag, Feature name, Capacity if it is Borrowed or Queued, User Machine ID, Checkout Time, and Total Time in Use. The table can be sorted from longest checkout to shortest checkout. There are 3 ways to get this report:
- By selecting the Tool from the “Current” tab dropdown, then Details
- By selecting the blue Feature name in the Current Overview, then Details
- By selecting the blue Feature name in the Gauge Display, then Details
The remote button allows reclaiming of FlexLM licenses if necessary. “Remove” (lmremove) requires specific FlexLM admin permissions.
24×7 Activity Reports – “Checkout Heatmap” and “Denials Heatmap”
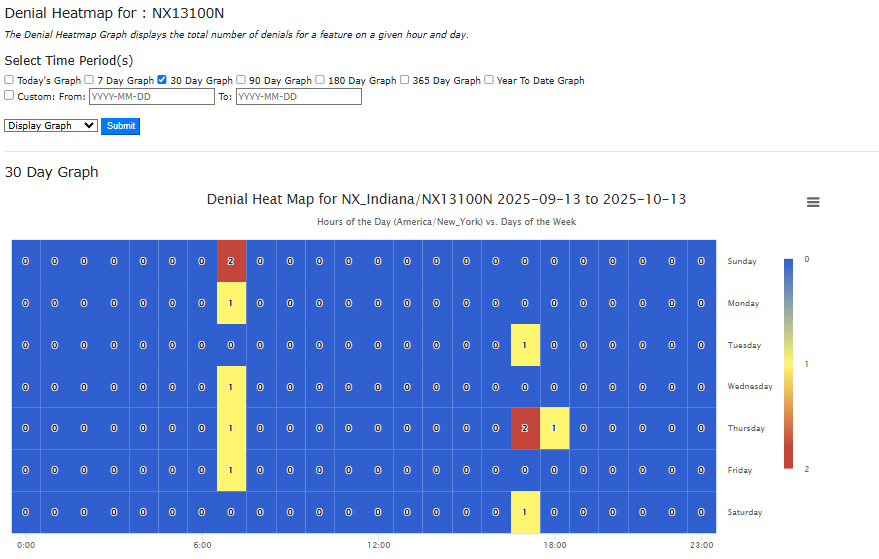
Remember, floating licenses are like books in a library. You buy 10 and they sit on the shelf. Wouldn’t it be nice to know that you never needed more than 5 books? The heatmap shows the 24×7 usage of all the activity throughout the day. The neatly organized (and vibrant) information puts into perspective the way assets are being used (checked out) or when denials are occurring.
Visualize License Checkout Patterns
Knowing usage patterns will save you both engineering time and money. Heatmaps will visually show you how licenses are used in a 24×7 graph, and when licenses are not being used.
Can you squeeze out more usage from existing licenses by letting engineers know that licenses are available at non-peak times?
Knowing trends of usage is also important. Engineers will stay away for peak use times, tend to fill in the gaps, reduce denials and delays associated with that. LAMUM provides both Checkout Heatmaps and Denial Heatmaps.
Engineers will tend to stop hoarding licenses if they realize that other Engineers can see how long they have had a license checked out.
The denials heatmap shows the days and times when denials are occurring. These graphs are helpful for engineers to better manage their workloads by knowing when licenses are available or when they may need to wait.