
In today’s engineering environments, software is the engine that keeps innovation moving forward. Still, without proper license management, even the best tools can turn into bottlenecks. Teams face denied access, unused licenses sit idle, and costs quietly creep upward.
Gradually, these inefficiencies do more than drain budgets. They impact timelines, frustrate engineers, create friction and slow down engineering productivity. That is why organizations are turning toward smart, data-driven approaches to software license management.
TeamEDA offers a practical solution – LAMUM. It brings clarity to how licenses are used, where inefficiencies exist, and how decisions can be improved. Among its capabilities, three features stand out for driving long-term license optimization and sustained efficiency.
Let’s walk through them.
1. Smart Alerts That Keep License Usage in Check
Managing software licenses without visibility is akin to steering a ship in dense fog. You may move forward, but risks are always lurking. LAMUM’s alert feature illuminates critical areas for a smooth sailing. LAMUM shows critical usage patterns and ensures that administrators stay one step ahead.
Designed to be both proactive and reactive, these alerts bring immediate attention to potential inefficiencies, policy deviations, and usage anomalies.
Key Alert Types
1. Capacity Threshold Alerts
These alerts notify administrators when license usage approaches its maximum limit. This helps teams prepare for demand spikes and avoid unexpected denials.
2. Denials Threshold Alerts
When users are repeatedly denied access, it signals a mismatch between demand and availability. These alerts highlight peak usage trends and help identify whether additional licenses are needed.
3. Long Checkouts Alerts
Licenses that remain checked out beyond reasonable timeframes can indicate misuse or inefficiency. This alert in particular flags such behavior and helps enforce usage policies.
4. Available License Alerts
This feature benefits end users directly. It notifies them when a license becomes available, reducing idle waiting time and improving workflow continuity.
Strategic Impact
With these alerts in place, engineering organizations can:
- Detect license abuse or inefficient usage patterns
- Reduce downtime caused by license shortages
- Improve software usage tracking with actionable insights
- Align resources with peak operational demands
In simple terms, alerts in LAMUM act as an early warning system. They keep operations smooth and ensure that no license goes to waste.
2. History Graph for Data-Driven Decision Making
While alerts identify immediate concerns, the History Graph provides the context necessary for informed strategic decisions. If alerts tell you what is happening now, the History Graph explains why it is happening.
Turning raw usage data into actionable intelligence, historical data is gold in the world of license optimization. It reveals patterns, highlights inefficiencies, and supports long-term planning.
Key Functionalities
LAMUM’s History Graph provides a flexible and detailed view of license activity. It can be used in several impactful ways:
1. Trend and Peak Analysis
Understand how license demand fluctuates over time. This is especially useful during events like product launches, hiring cycles, or seasonal spikes.
2. Forecasting and Planning
Historical insights can guide decisions for license renewals, new product introductions, or workforce expansion.
3. Identifying Waste
Spot underutilized licenses that can be reduced or reassigned, leading to cost savings.
4. Choke Point Detection
Compare historical peaks with alerts such as capacity thresholds and long checkouts to identify blocks.
Long-Term Value
This feature strengthens software asset management by turning data into strategy. Instead of relying on assumptions, organizations can make informed decisions backed by real usage patterns.
Over time, this leads to:
- Better budget allocation
- Improved license utilization
- Reduced unnecessary spending
- Enhanced operational efficiency
What is said is right, “what gets measured gets managed.” The History Graph ensures that license usage is not only measured but also understood.
Interpreting License Utilization: A LAMUM Example
The graph below is a real example pulled directly from LAMUM – a 7-day historical view of 10 licenses for the NX_Indiana/NX13100N product, tracked from March 4 to March 10, 2026.
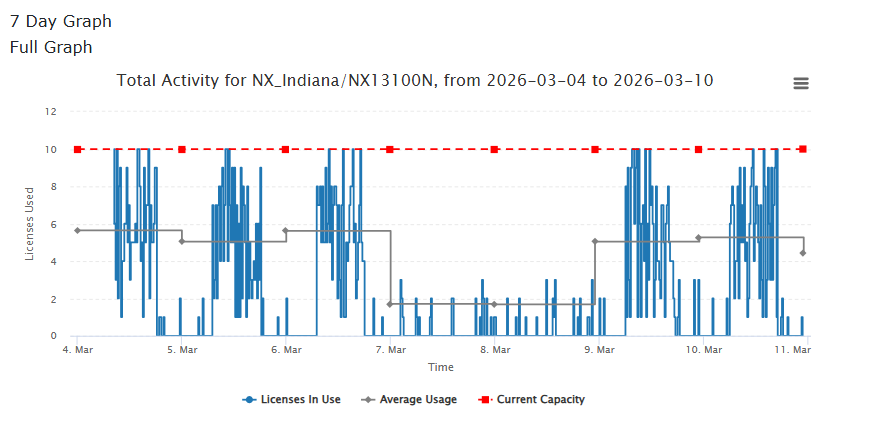
Three data series tell the story at once.
- The blue bars show licenses in active use at any given moment.
- The gray line tracks the rolling average – smoothing out the noise to show typical demand.
- The red dashed line marks the capacity ceiling of 10.
Two patterns stand out immediately. First, usage repeatedly hits the hard ceiling of 10, meaning engineers are almost certainly encountering checkout queues or denials during peak hours – a productivity cost that never appears on an invoice. Second, the visible dip between March 7 and March 9 points to a period of low activity, likely a weekend, where average utilization fell well below the licensed pool.
This is precisely the kind of visibility LAMUM is built to provide. With a license optimization strategy in place, low-utilization windows like these become decision points – opportunities to right-size the pool, recover costs, or redistribute access. Without that visibility, the pattern simply repeats, and the gap between what you’re paying for and what you’re actually using quietly widens.
One week of data may look like a minor variance. Aggregated over a year, that gap compounds into a measurable cost – one that organizations with mature license management practices consistently eliminate.
As the principle goes: what gets measured gets managed. The History Graph ensures license usage is not just measured, but understood well enough to act on.
3. Current Overview Dashboard for Real-Time Visibility
While historical insights are valuable, real-time visibility is equally important. Decisions often need to be made in the moment, especially during peak usage hours.
LAMUM’s Current Overview dashboard provides a clear, real-time snapshot of license activity across the organization.
Live License State at A Glance
The current dashboard image below shows 9 active license entries across four products – Accurev, MATLAB, and NX13100N across Indiana and Ottawa regions.
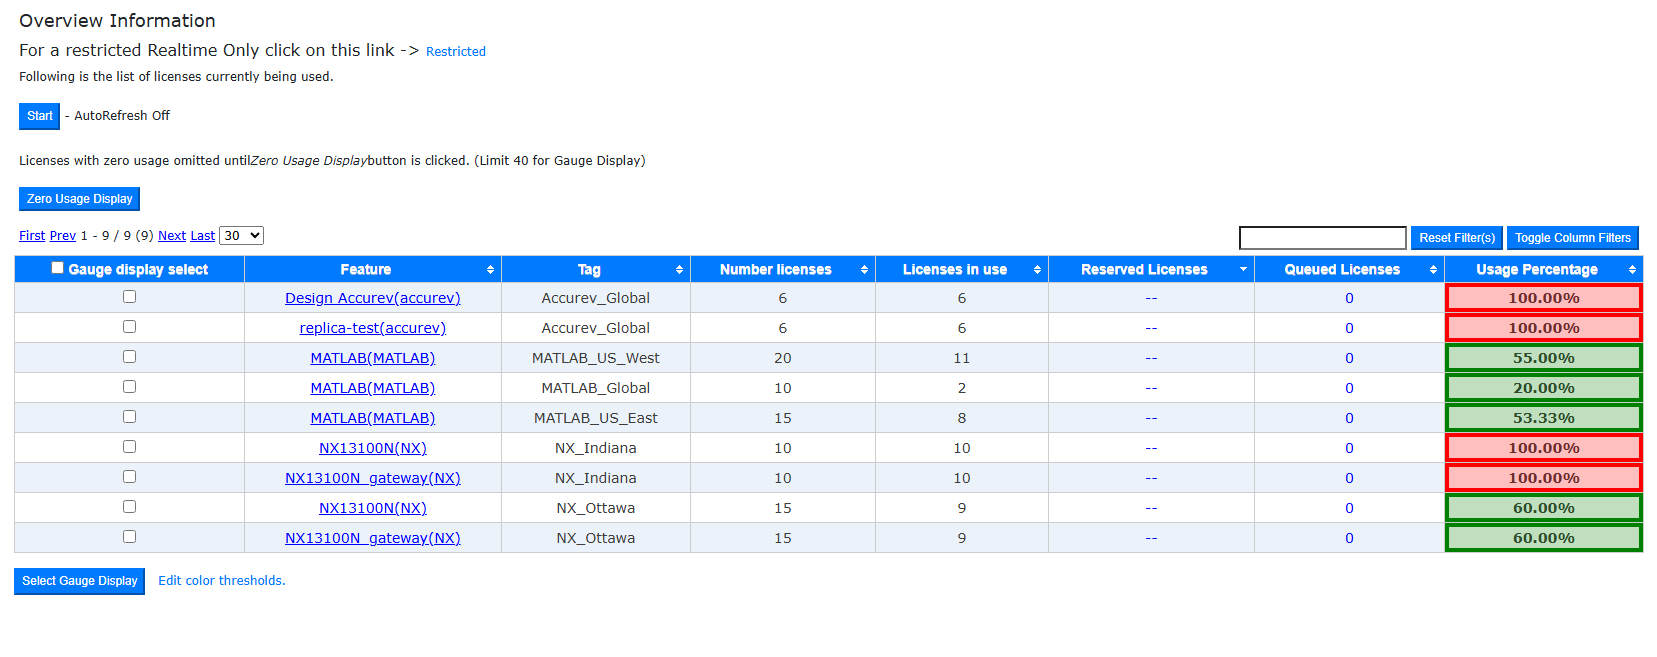
The color-coded usage percentage column does the heaviest lifting here. Red entries, including both Accurev pools at 100% and NX_Indiana at 100%, are fully saturated. Any new checkout request against those pools would queue or fail outright. Green entries, including the three MATLAB pools and NX_Ottawa at 60%, have comfortable room to absorb demand without disruption.
Notably, queued licenses across all entries currently read zero. But with four pools sitting at maximum capacity, that can change in a single request. This is precisely the moment the Current Overview dashboard is designed for: catching saturation before a queue forms, not after engineers start reporting blocked access.
Key Capabilities
1. Real-Time Monitoring
The dashboard displays current license usage, showing how many licenses are in use and how many are available.
2. Dynamic Updates
With a 30-second refresh option, the data remains up to date, allowing teams to respond quickly to changes.
3. Usage Percentage Indicators
Color-coded indicators highlight usage intensity, making it easy to identify high-demand periods at a glance.
4. Comprehensive Visibility
Gain complete insight into your license inventory and make informed optimization decisions based on real-time data. In essence, it provides a bird’s eye view of your entire engineering software landscape.
Practical Outcomes
These LAMUM features play a critical role in improving license management by:
- Helping administrators respond to demand in real time
- Reducing the chances of license denial during peak hours
- Supporting better decision-making under pressure
- Enhancing user experience for engineering teams
When teams can see what is happening as it happens, they can act quickly and confidently. This reduces friction and keeps workflows running smoothly.
LAMUM Features for Maximum Impact
Each of these features serves a unique purpose, yet they work best when combined.
- Alerts ensure that issues are identified early
- History Graphs provide the context needed for strategic planning
- Current Overview dashboards enable real-time action
These features create a well-rounded framework for license management that maximizes license utilization, enhances software usage tracking, and drives measurable gains in engineering productivity.
Over time, these improvements add up. Costs are controlled, teams work more efficiently, and software investments deliver greater value.
Learn more about LAMUM!
Final Thoughts
Managing software licenses may seem like a back-office task, but its impact reaches far beyond. It influences productivity, cost efficiency, and even employee satisfaction.
LAMUM simplifies this complex challenge. Its features provide clarity, control, and confidence in managing engineering software licenses. In a fast-paced environment, having the right tools can make all the difference. And when those tools are backed by data and designed for efficiency, the path forward becomes much clearer.
Improve your license management strategy and unlock the full value of your software investments. Explore how LAMUM can help you achieve better license optimization, improve license utilization, and elevate your team’s engineering productivity.
Take the first step toward more efficient and intelligent software asset management. Fill out the form below to request your LAMUM demo today.